This article is an excerpt from our longer 10-part series. To read the entire series, please go to TractIQ.com/resources.
First, let’s begin with some context and a few definitions. Self-storage customers sign monthly leases, which can be a double-edged sword. Storage operators often increase customer rental rates as the demand for storage grows within a market. This responsiveness helps operators capture revenue quickly in times of strong demand. On the flip side, as demand weakens, customers can leave at a moment’s notice.
Due to the fast-paced nature of self-storage operations, advertised rental rates vary widely at the facility level. Let’s define some key terms that are foundational to understanding self-storage pricing dynamics:
- Web Rates – The rates advertised online, often discounted to attract price-sensitive shoppers.
- Street Rates – The street rate for a particular unit is the rate that a customer would be charged if they were to walk in off the “street” to rent a unit in person at the facility.
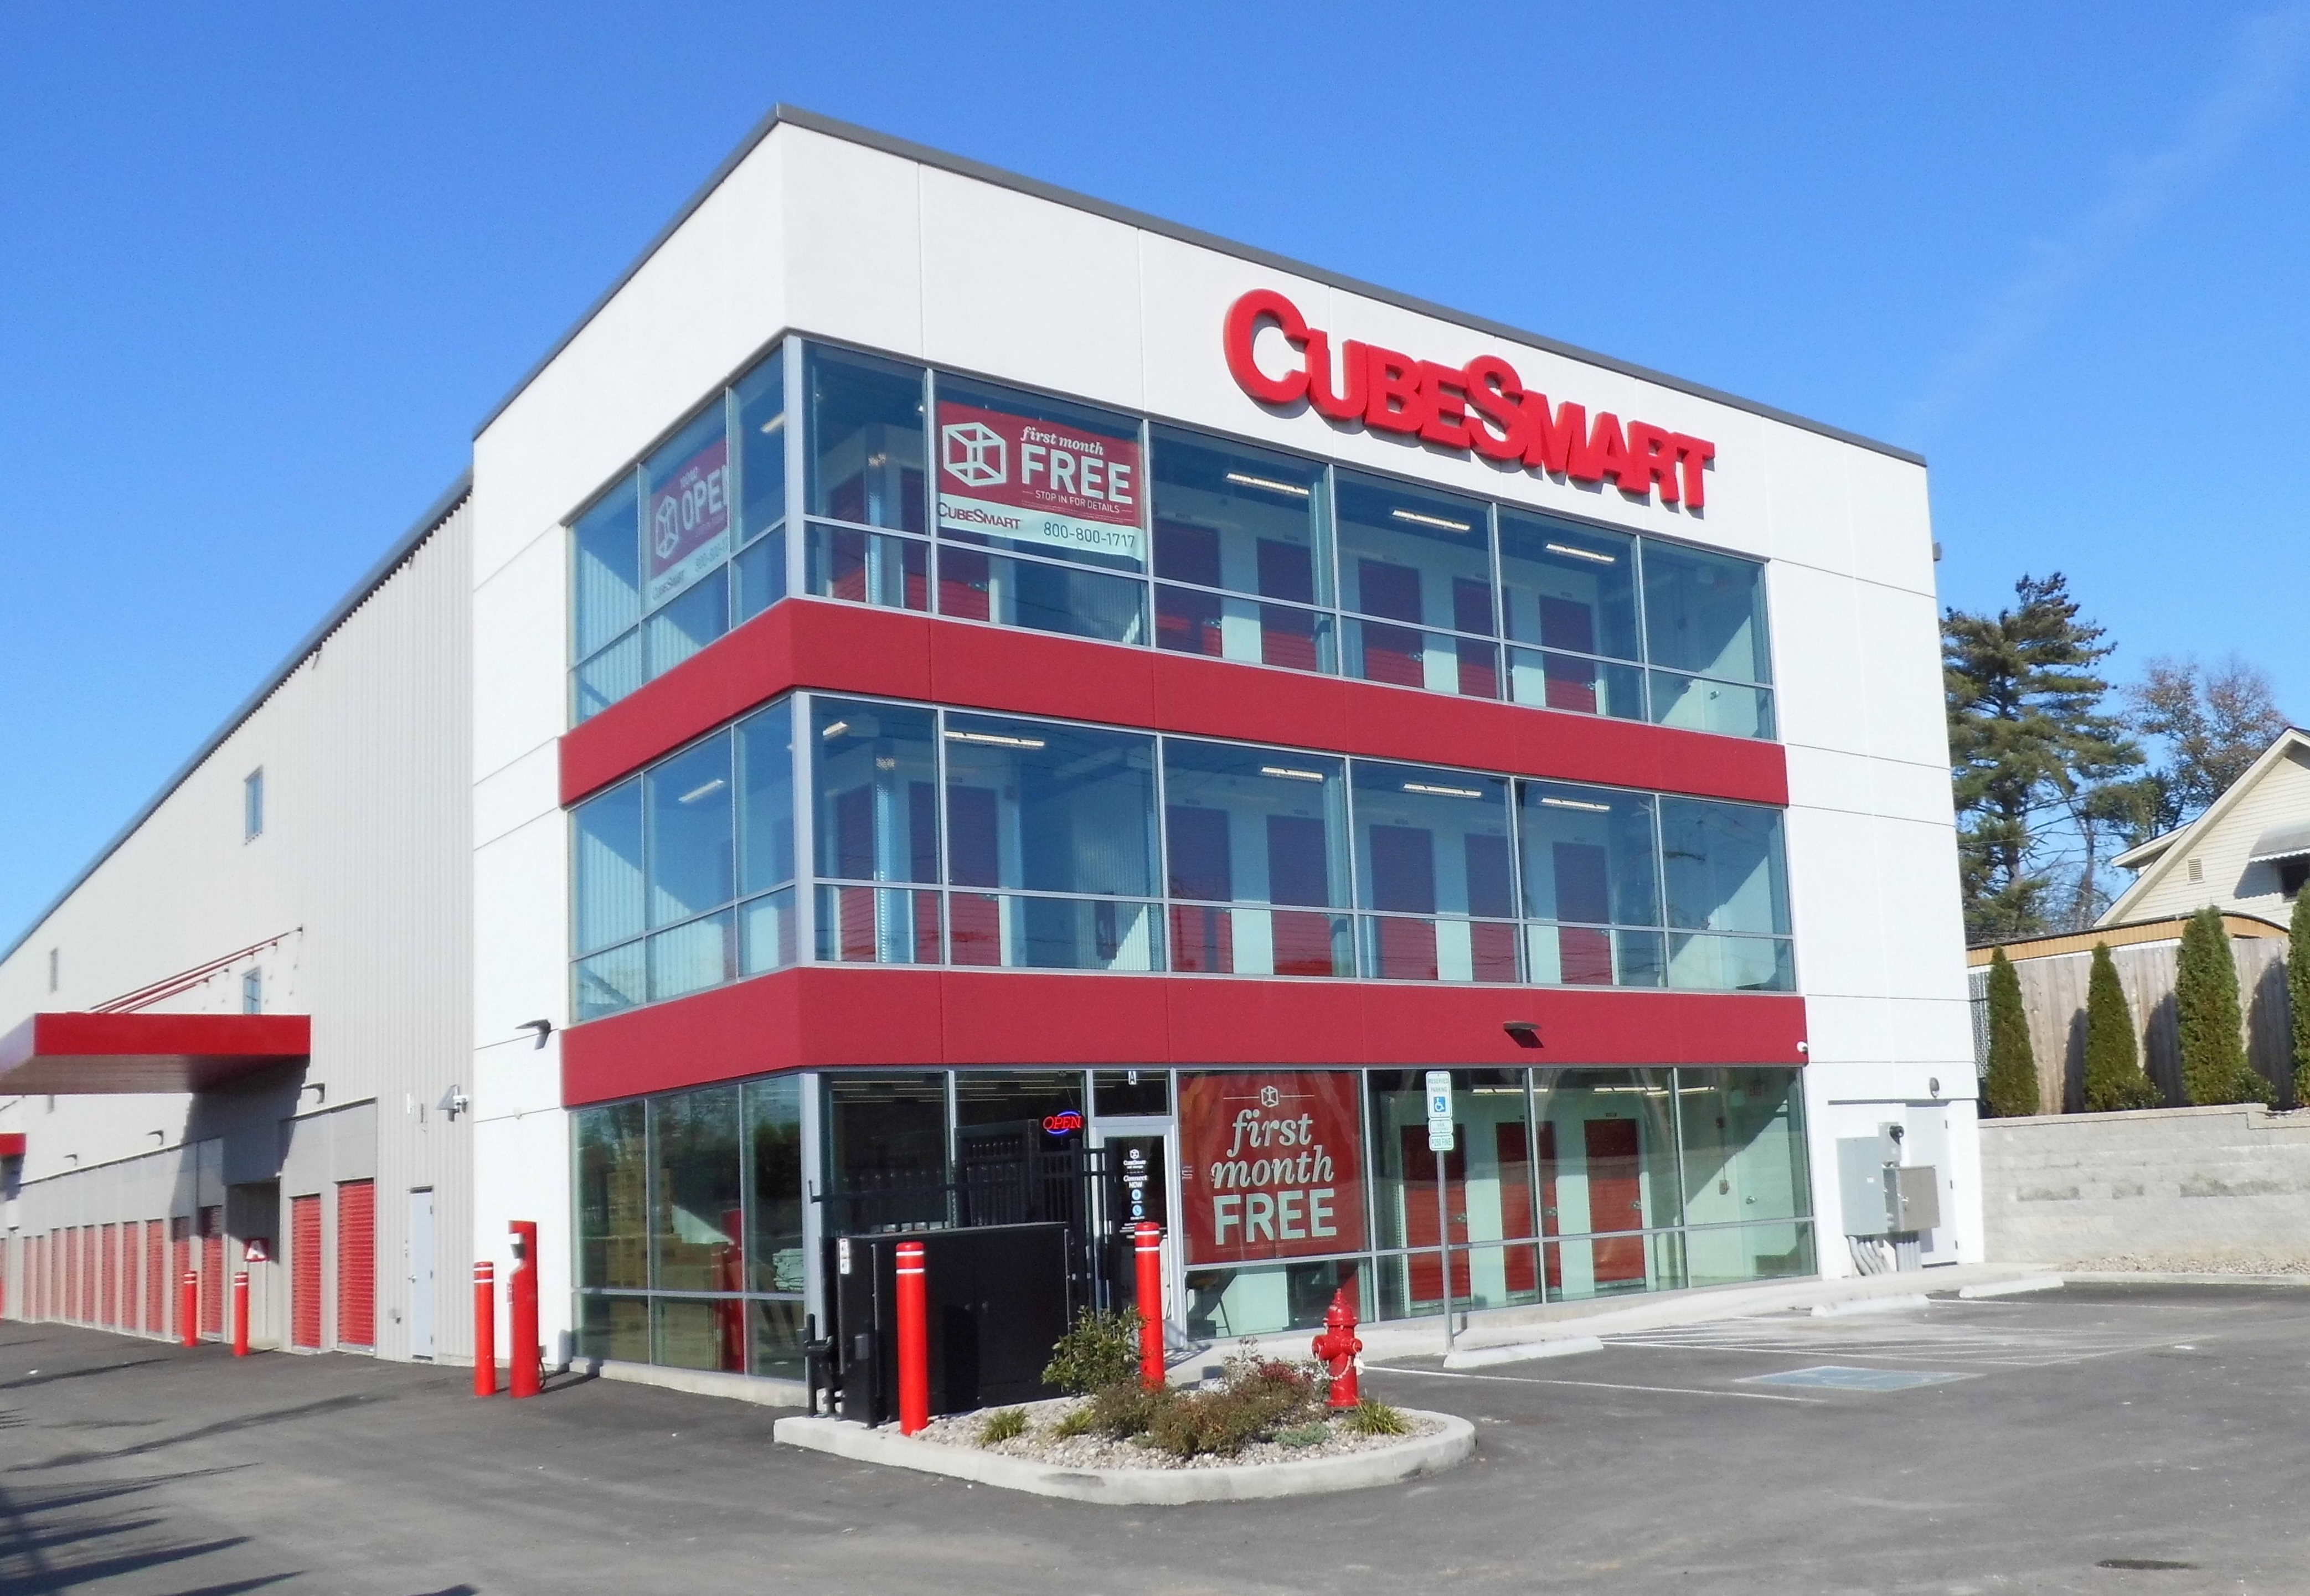
See an example from a CubeSmart facility below.
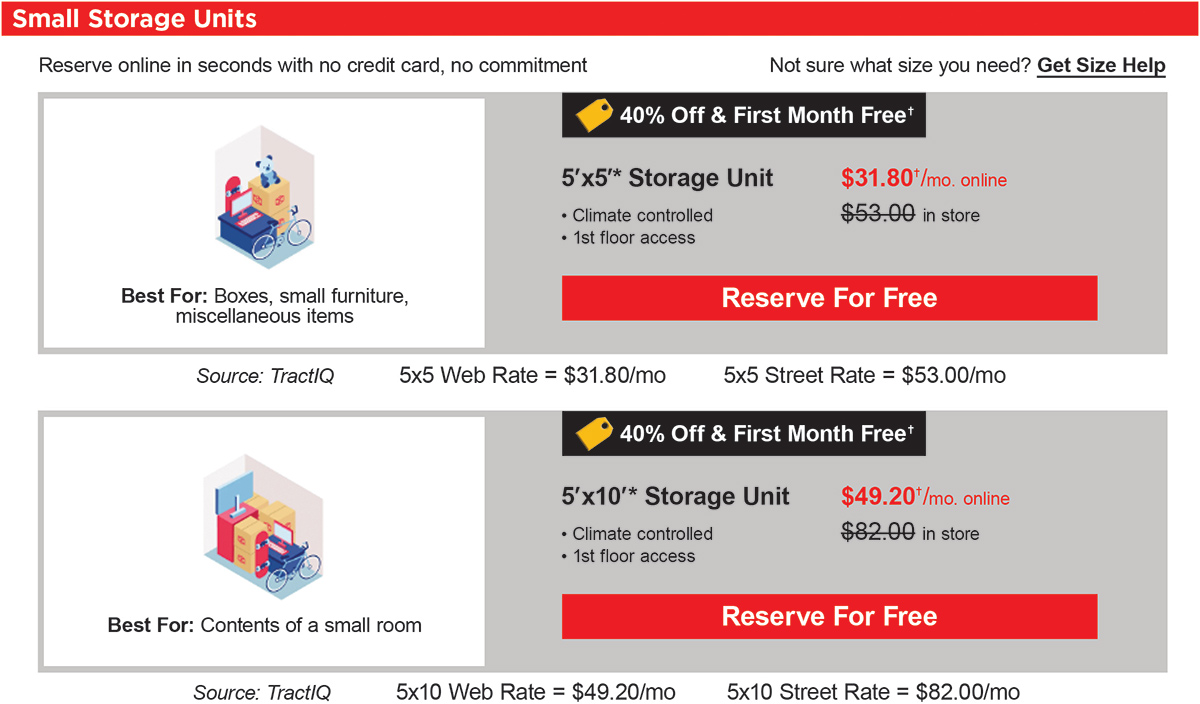
- 5-by-5 Web Rate = $31.80 per month
- 5-by-5 Street Rate = $53.00 per month
Now that we have a foundational understanding of street and web rates, we can further explore what these rates and their relationship tell us about self-storage demand.
2018 To 2020
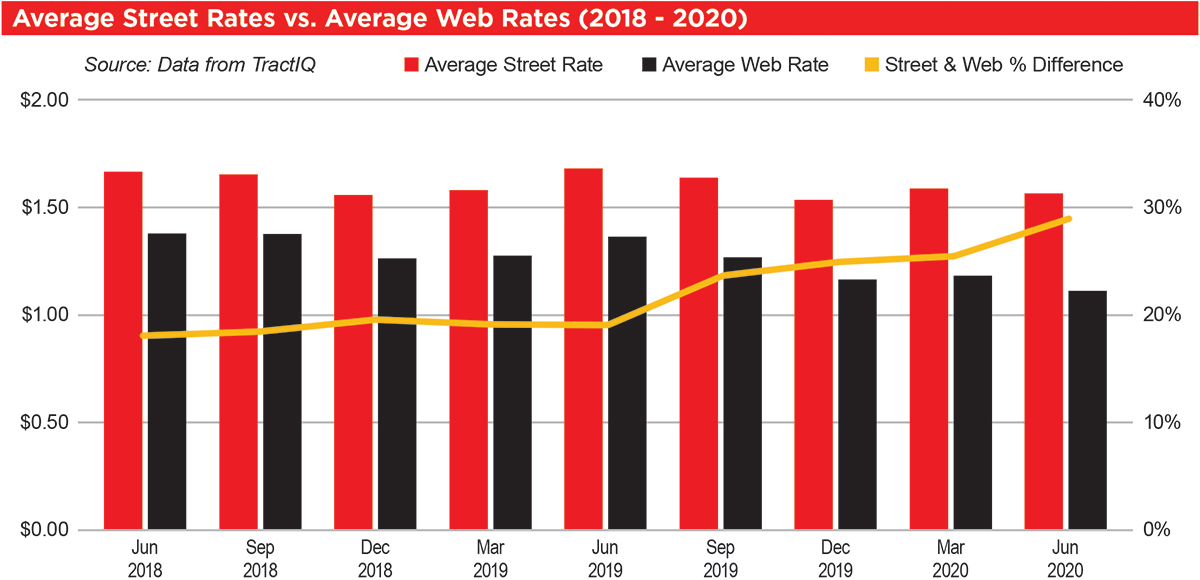
- Policy shifts at the Federal Reserve,
- Trade negotiations, and
- The yield curve inverted.
New storage supply was also beginning to lease up after a record year in 2018. According to the 2020 Self-Storage Almanac, the total value delivered in 2018 was estimated at $5.25 billion, a 33 percent increase from 2017.
2020 To 2022

During this time, people relocated from city centers to suburban areas. Interest rates were low, making it more affordable to change residences, which is a major storage demand driver.
As a result of lower interest rates and migration from city centers during COVID, demand for self-storage significantly increased. Evidence of this can be seen in the chart, as discounting started to decrease in late 2020 (yellow line).
2022 To 2024
- Increasing interest rates and
- Oversupply.
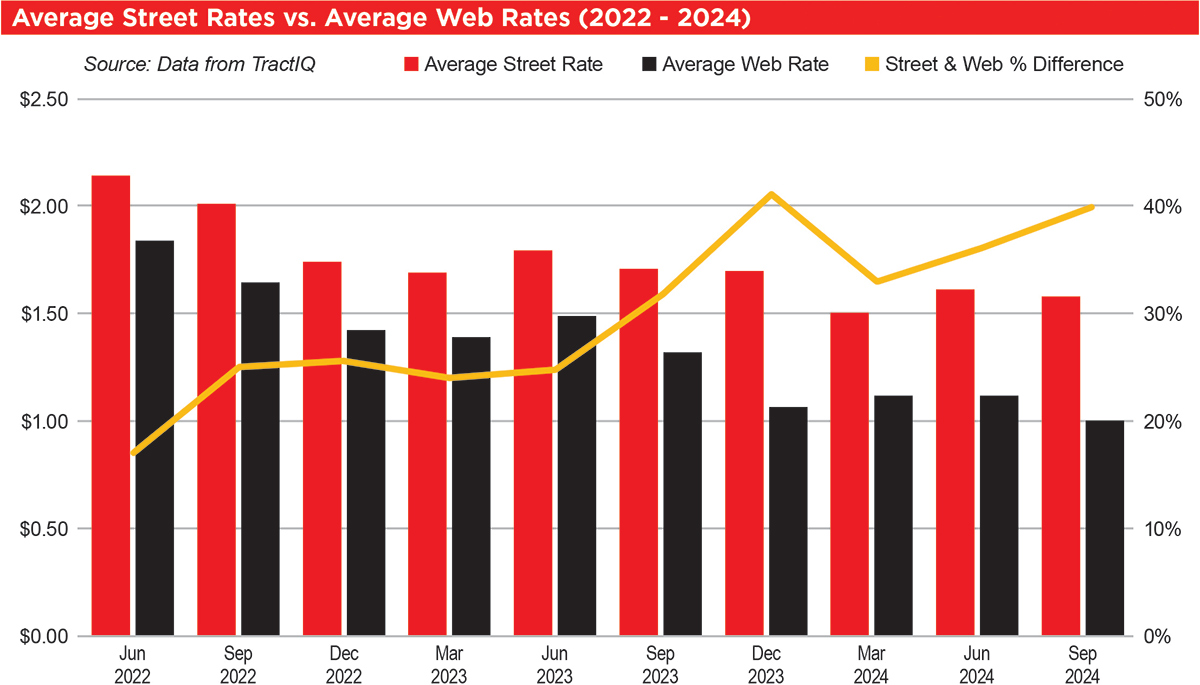
While 2023 marked a record year for self-storage construction spending, self-storage demand peaked in 2021.This is an unfortunate lag in timing, as newly built self-storage projects began to deliver in 2023 during a time of decreasing demand.
Oversupply creates more competition between operators and shifts pricing power to the customer. In Q3 2024, the difference between street rates and web rates was approximately 40 percent. This level of discounting even exceeds early-COVID levels, which was approximately 30 percent at its peak.
REIT Discounting Strategy
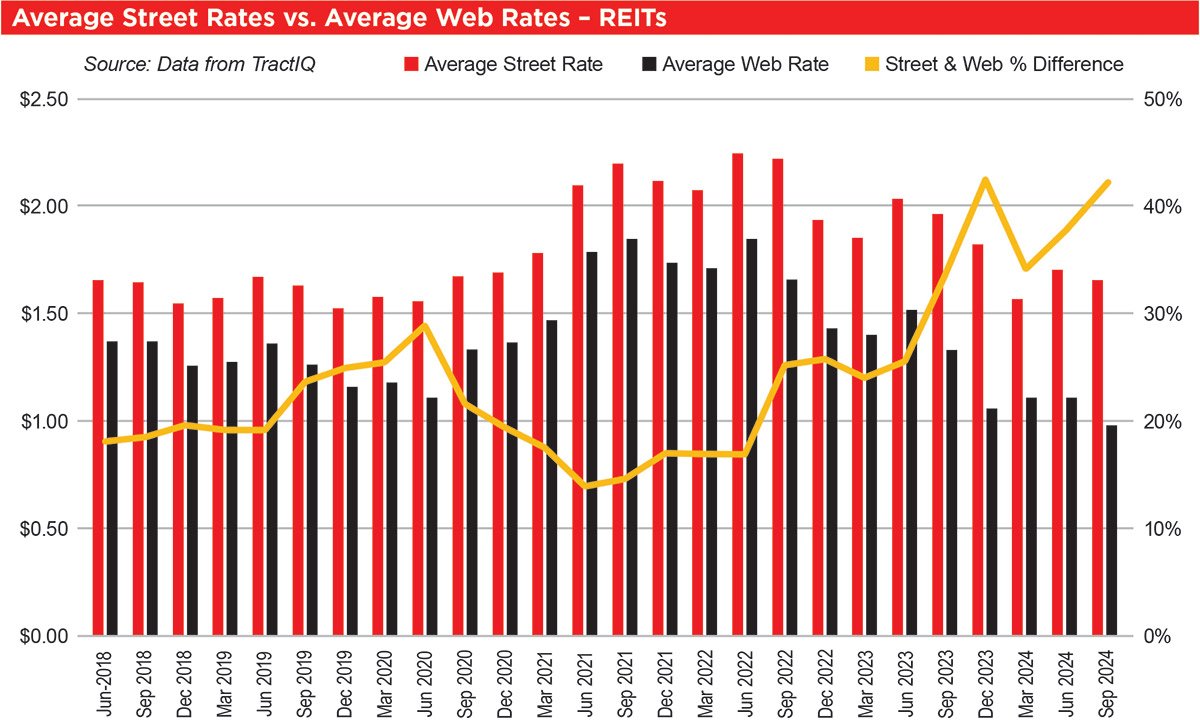
- REITs have robust revenue management teams and change rates quickly using complex algorithms.
- REITs have a volume advantage. The cost of a single customer defecting from a single store is low.
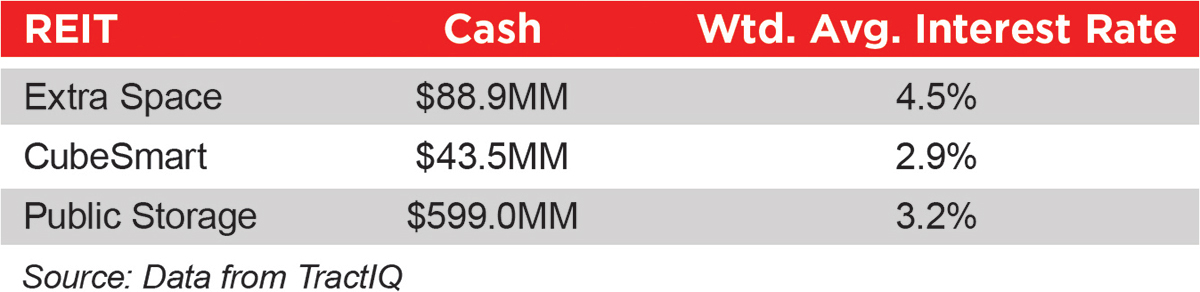
- REITs have large cash reserves and the lowest cost of capital. The REIT table shows cash balances and weighted average interest rates on all debt for the REITs as of Sept. 30, 2024.
Strategies For Non-REITs

Most non-REIT operators do not have the revenue management teams that the REITs do, so they do not change prices as often nor as aggressively.
Despite all of this, non-REIT operators do respond over time, with a steadily increasing discount rate from approximately 18 percent to approximately 30 percent leading up to COVID.
Discounting Correlates To Occupancy
Take a look at the Extra Space, Cubesmart, and Public Storage charts. If we take a step back, what story does this data tell us?

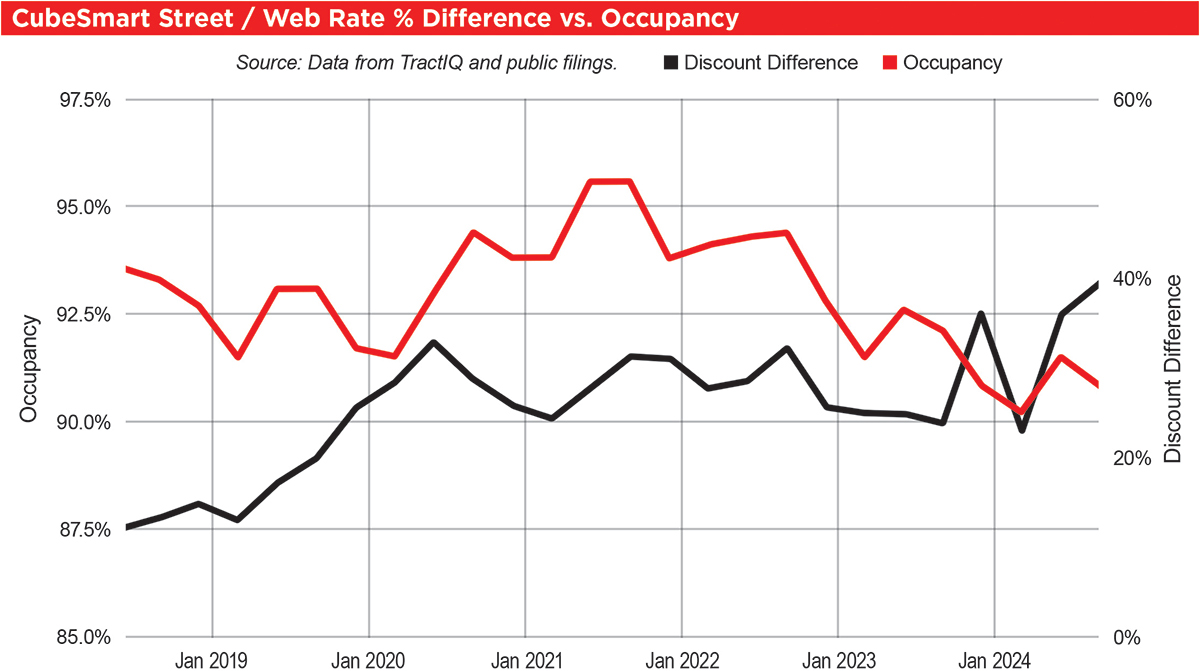
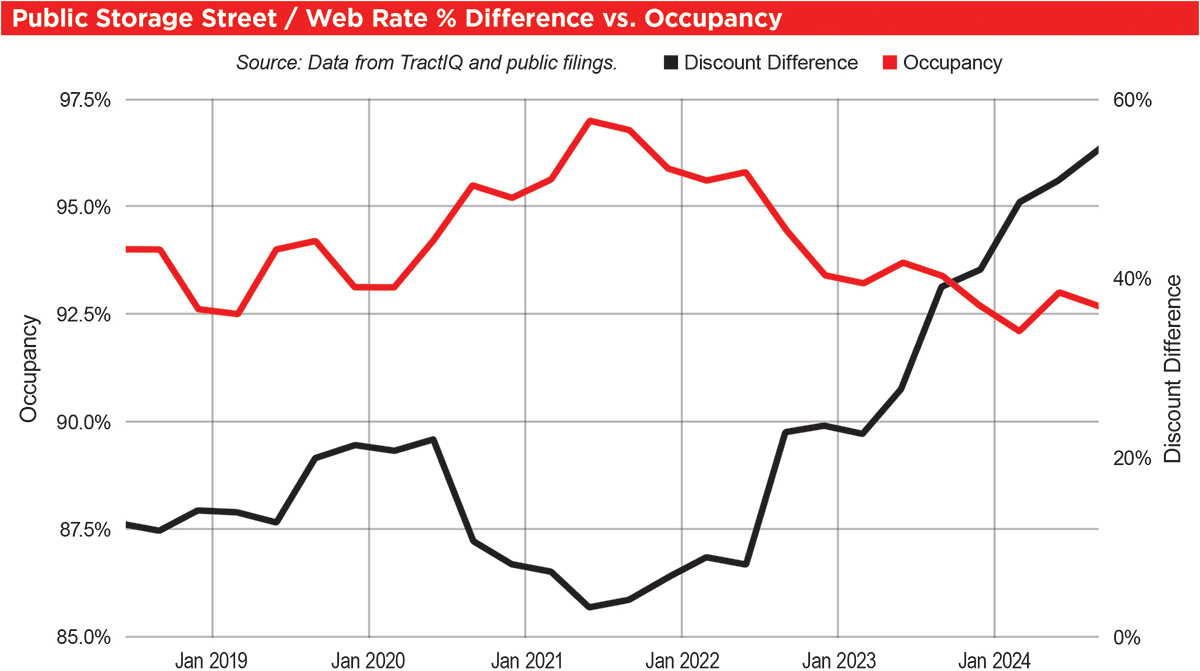
- A wide spread between street and web rates typically signals less self-storage demand because operators are competing more for customers by discounting web rates.
- A tight spread between street and web rates typically signals more self-storage demand because operators don’t need to discount web rates as much when more customers are renting storage.
- REITs are major drivers for rate discounting trends with non-REIT operators typically following the same trends in less aggressive ways.
Paying attention to street and web rates provides valuable insights as we all look to make smarter, data-driven investment decisions in 2025 and beyond.
–
COMMENTS
Popular Posts

The self storage industry is in a precarious...

Like its name implies, Surprise, Ariz., a...

Joe Shoen has had enough.

Joe Shoen is taking a stand. In our...

In a record-breaking deal finalized May 12,...

Self-storage software is no longer...
Senate Bill 709 (SB709) has many in the...

Joe Shoen, CEO of U-Haul, has had enough.

Self-storage operators wear a lot of hats....

Donald Trump has just reclaimed the White...
Recent Posts
Joe Shoen is taking a stand. In our...
This year’s Facility of the Year winner for...
The Fletcher Storage facility in Redding,...

Like its name suggests, Surprise, Ariz., is...
In recognition of innovation and technology...
Things don’t always go as planned in...

Most of us have been there: a deadline...

intelligence (AI) has moved from shiny...